> ## Documentation Index
> Fetch the complete documentation index at: https://docs.vectorview.ai/llms.txt
> Use this file to discover all available pages before exploring further.
# Dashboard
> Vectorview will generate interactive dashboards which give you insights into user habits and how your embeddings are performing.
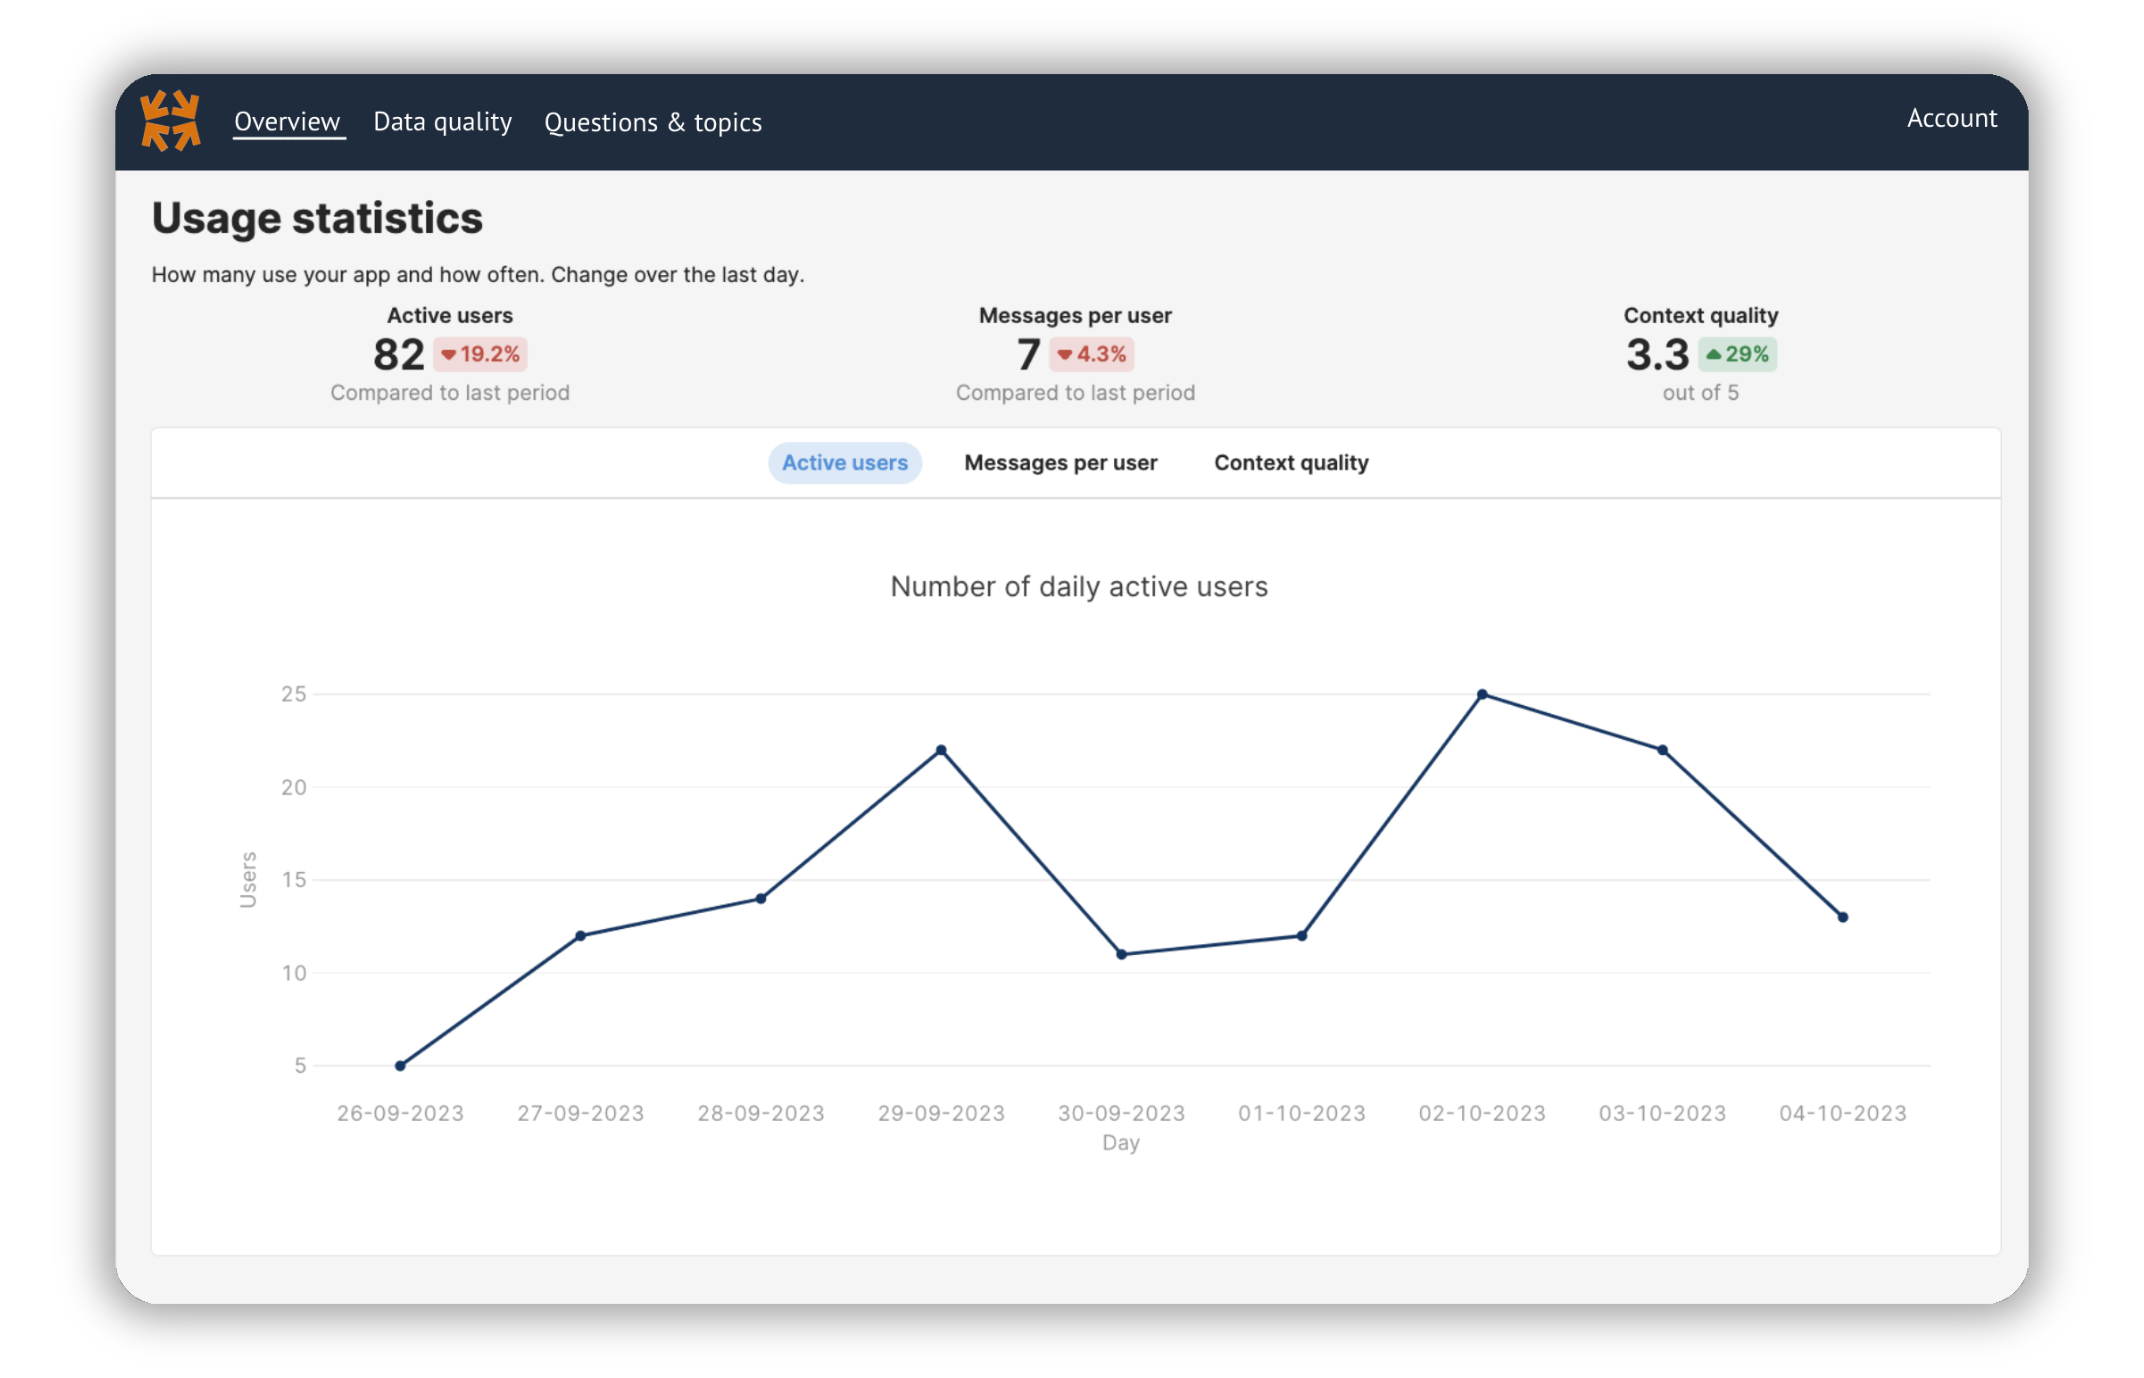
## Real time user statistics
Monitor how your app is used with real-time updates.
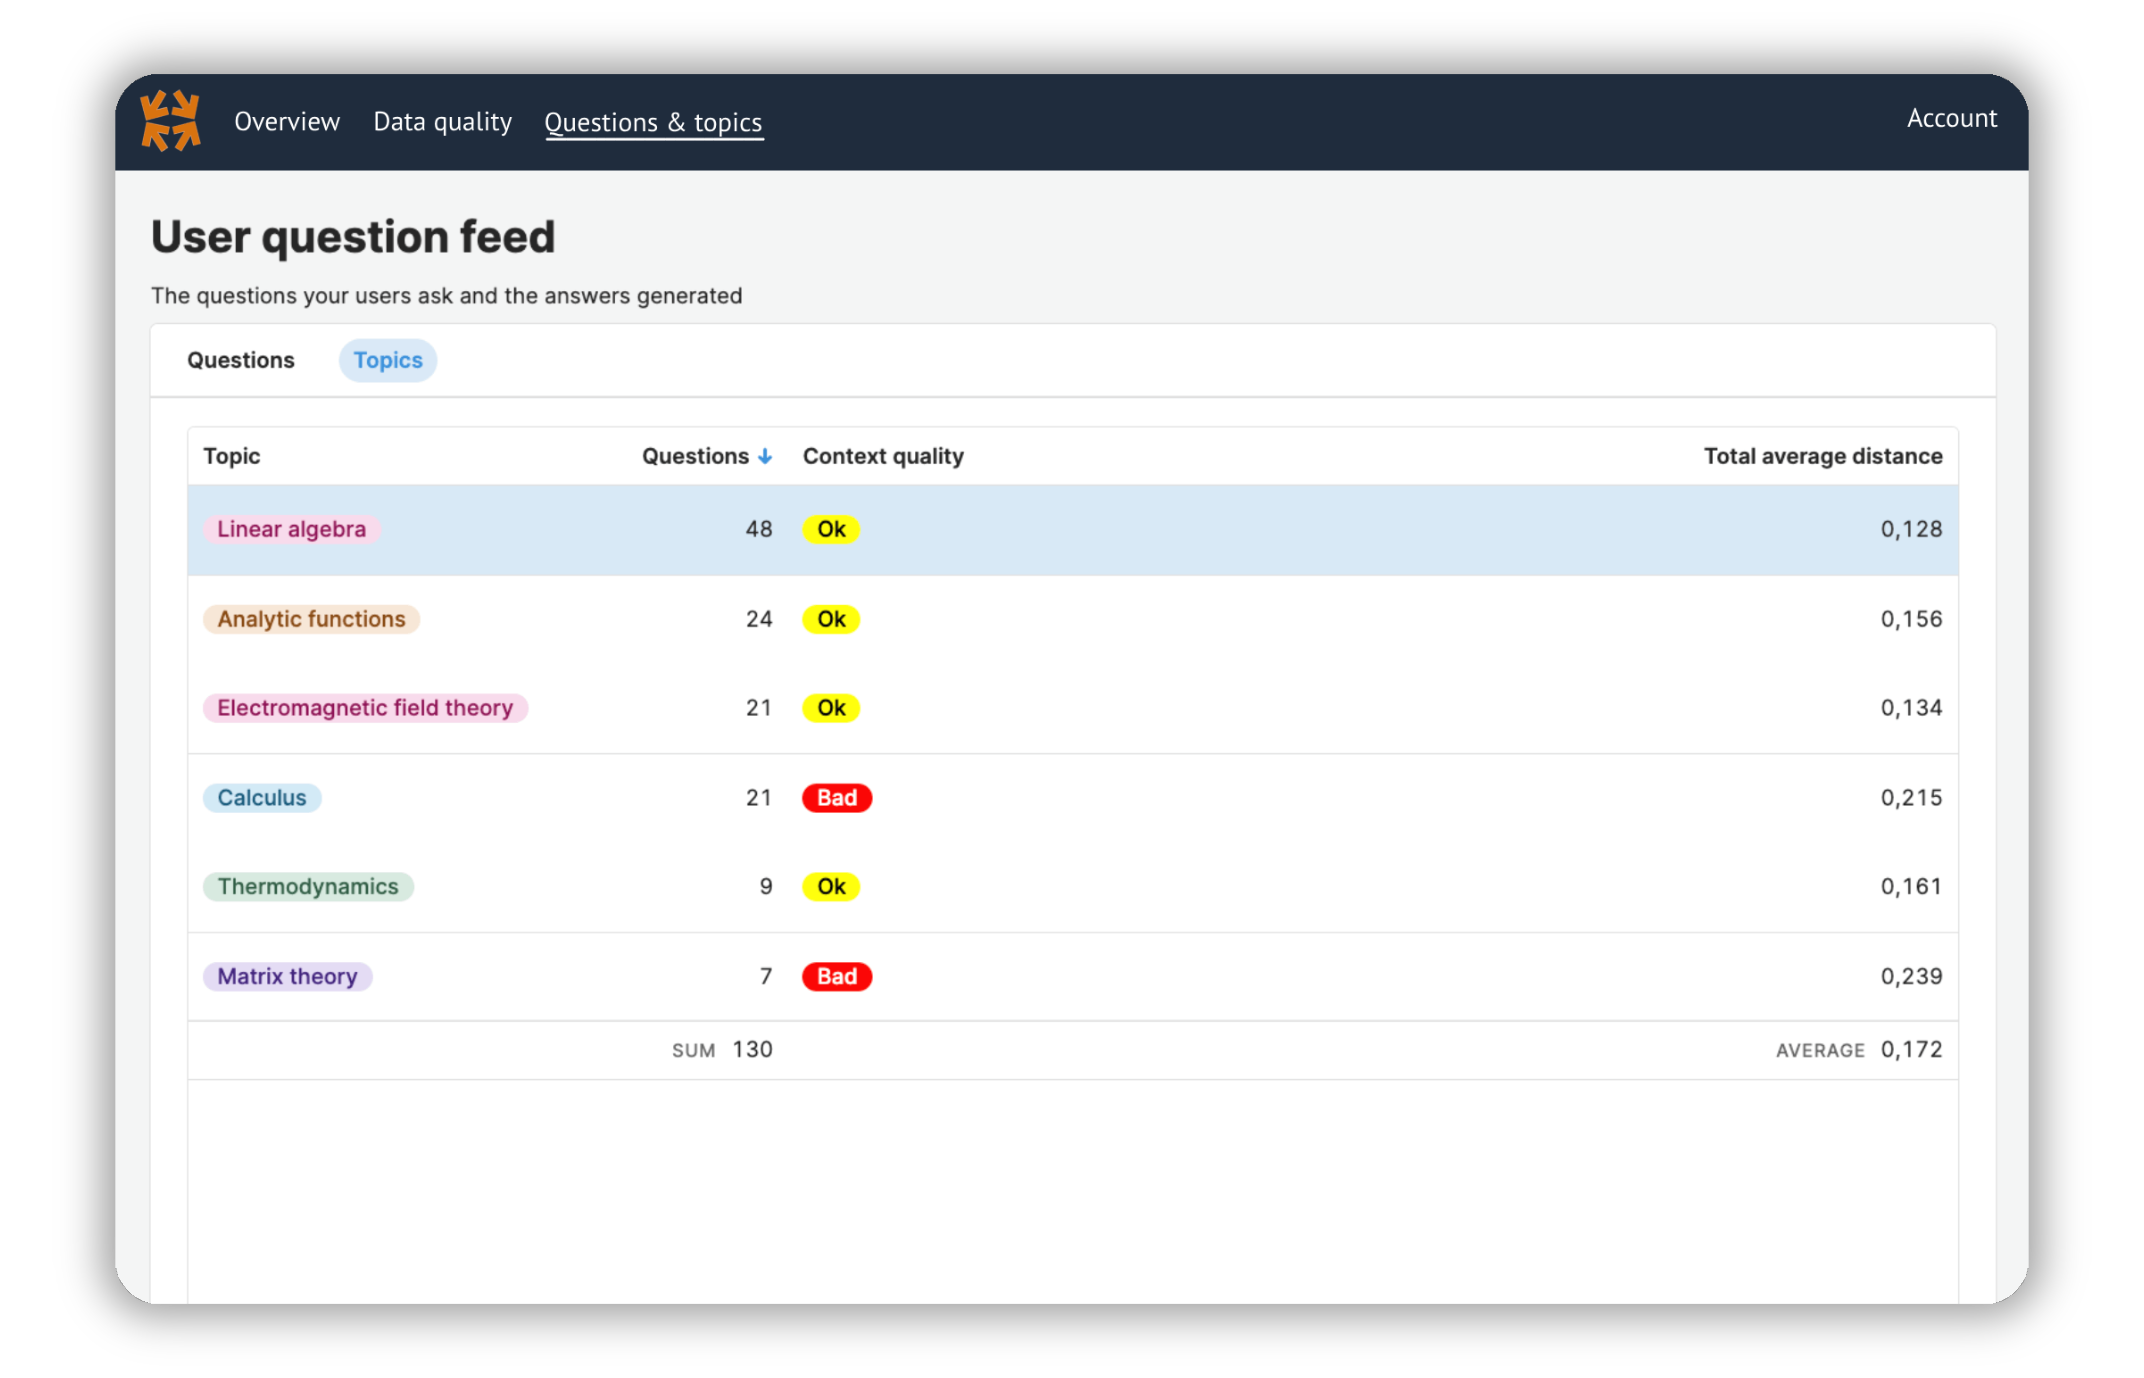
 ## Query logs
Log each query. Filter the statistics based on custom metadata. In this example, we filter on the topic of the content.
## Query logs
Log each query. Filter the statistics based on custom metadata. In this example, we filter on the topic of the content.
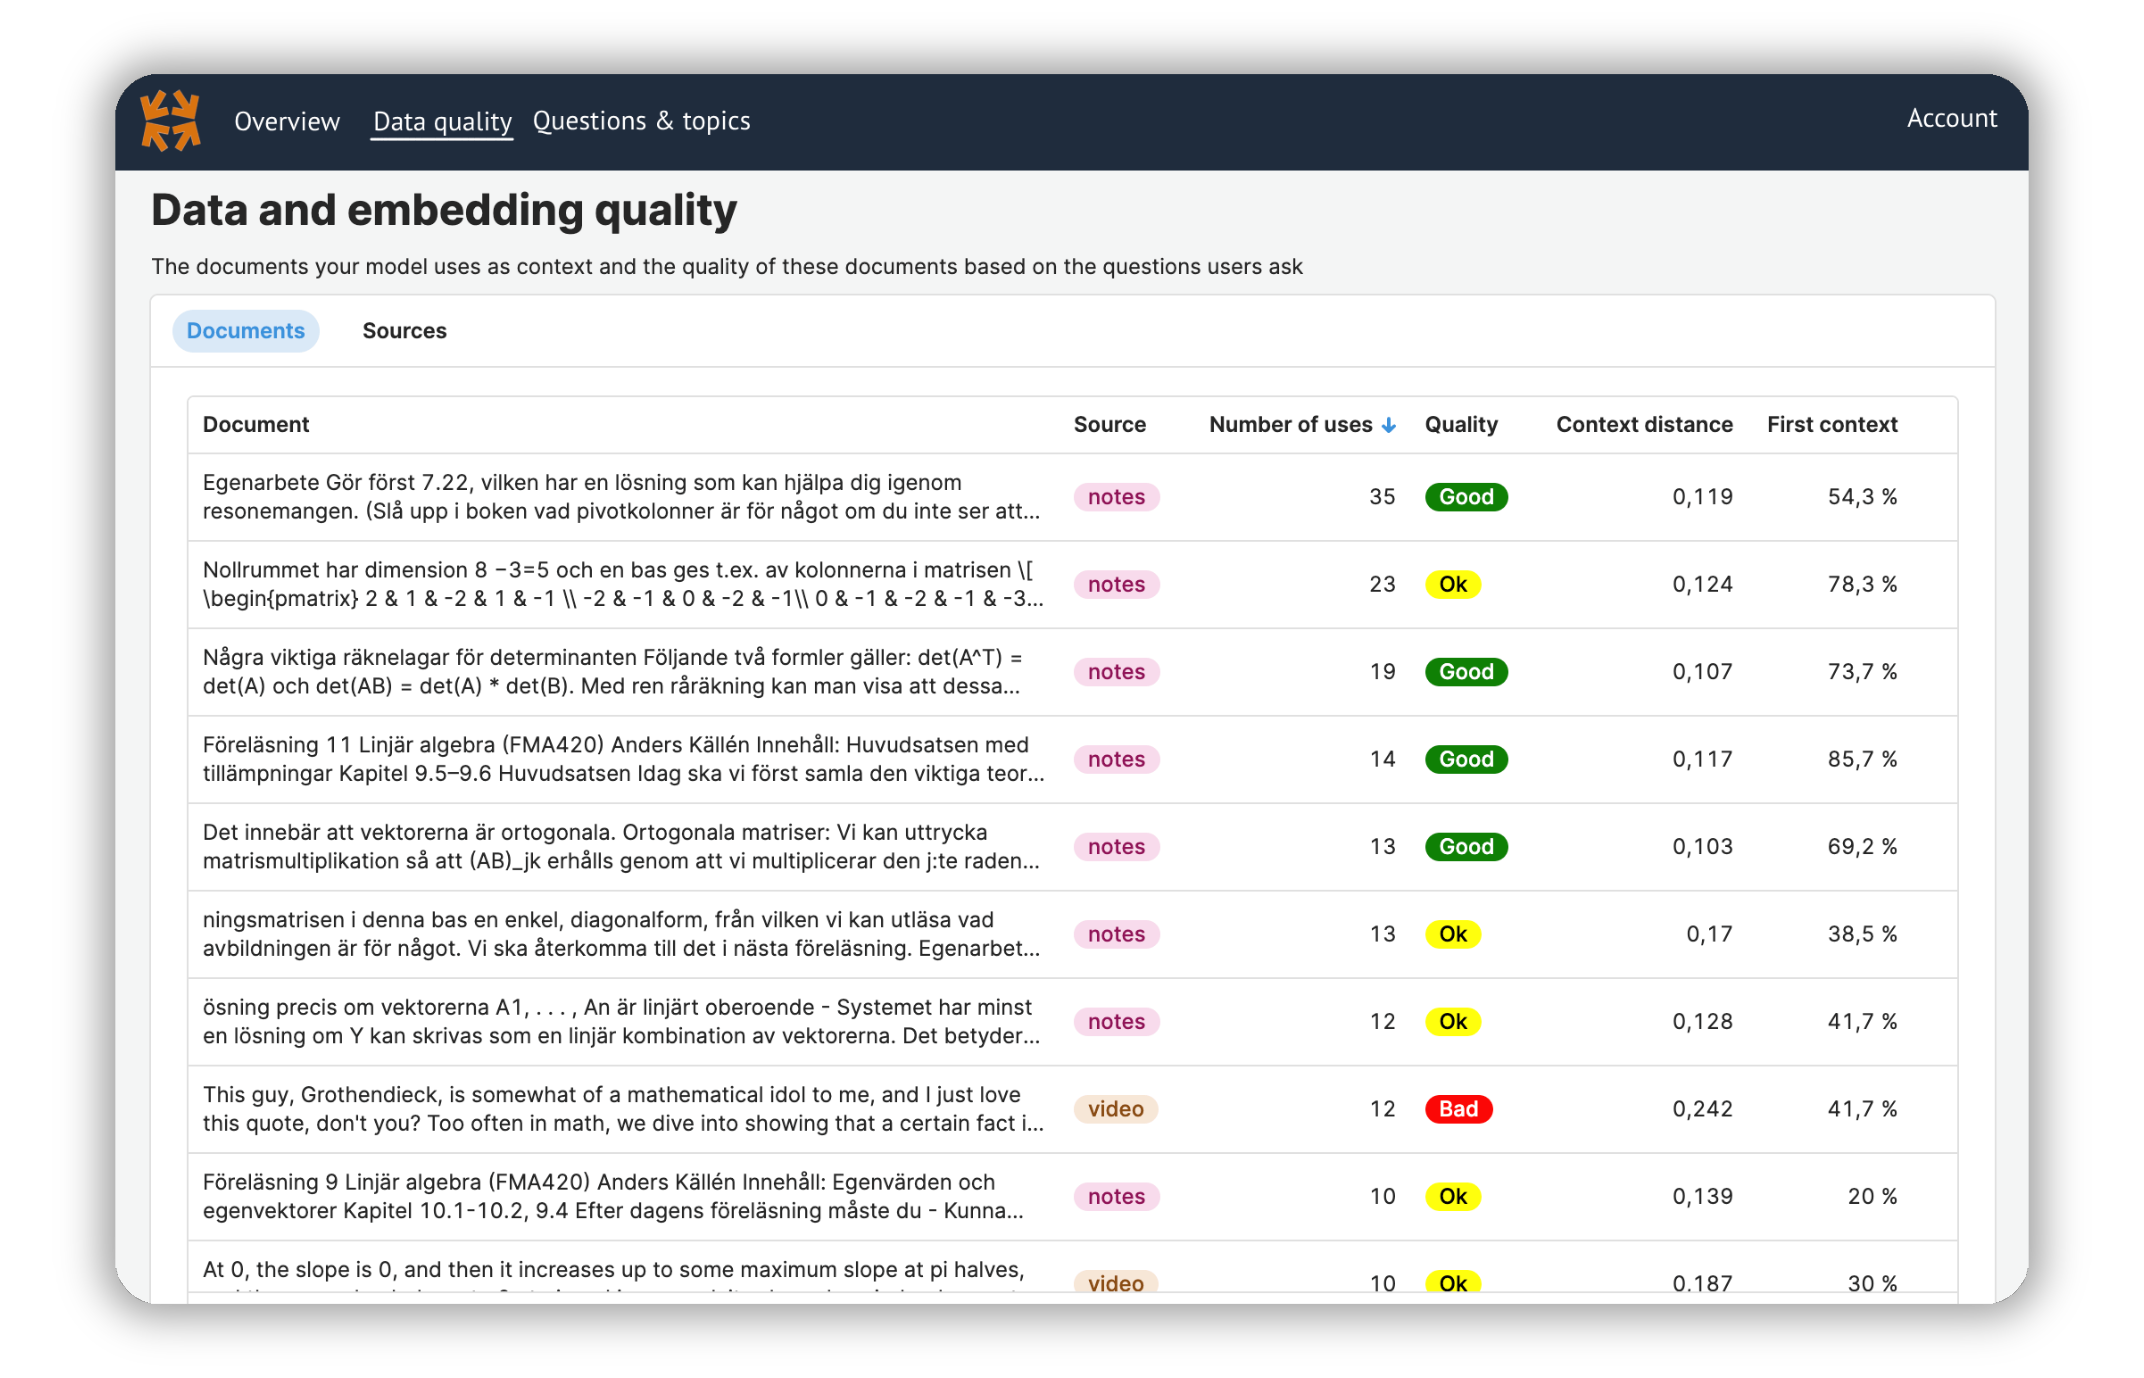
 ## Embedding performance
Statistics on how each individual embedding in your database is used.
## Embedding performance
Statistics on how each individual embedding in your database is used.